How concentrated is the QQQ Index ETF?
In the table below, you will find the component weights of the QQQ Index ETF representing the Nasdaq 100 index. For example, for every 1% or $1 move in NVDA, the index moves by the point value shown in the respective column (all else being equal). Note how the majority of price impact comes from the top 8 (out of 100) components of the index.
[ndx_impact_tool]
Why is ETF information useful for both active futures and stock traders?
First of all, index ETF data gives traders useful information for tracking the relative performance of a component compared to its index. In the next step, active traders look at the order flow in highly liquid sector ETFs for additional clues on the relative strength and weakness of the overall sector and individual ETF holdings.
Here are links to the most liquid sector ETFs for up-to-date data on their top holdings:
- Aerospace & Defense : ITA – iShares U.S. Aerospace & Defense ETF
- Airlines: JETS – U.S. Global Jets ETF
- Cannabis: MJ – Prime Alternative Harvest Index
- Banks: KBE – SPDR® S&P® Bank ETF
- Biotech: IBB – iShares Nasdaq Biotechnology ETF
- Cloud Computing: CLOU – Global X Cloud Computing ETF
- China Internet: KWEB – KraneShares CSI China Internet ETF
- Energy: XLE – The Energy Select Sector SPDR® Fund
- Health Care: XLV- The Health Care Select Sector SPDR® Fund
- Real Estate: REM – iShares Mortgage Real Estate ETF
- Materials: XLB – The Materials Select Sector SPDR® Fund
- Financials: XLF – The Financial Select Sector SPDR® Fund
- Medical devices: IHI – iShares U.S. Medical Devices ETF
- Oil Services: OIH – VanEck Vectors Oil Services ETF
- Oil & Gas Exploration and Production: XOP – SPDR® S&P® Oil & Gas Exploration & Production
- Online Retail: IBUY – Amplify Online Retail ETF
- Semiconductor: SOXX – iShares PHLX Semiconductor ETF
- Social Media: SOCL – Global X Social Media Index ETF
- Solar Energy: TAN – Invesco Solar ETF
- Tech Software: IGV – iShares Expanded Tech-Software Sector ETF
- Transportation: IYT – iShares Transportation Average ETF
- Video Gaming: HERO – Video Games & Esports ETF
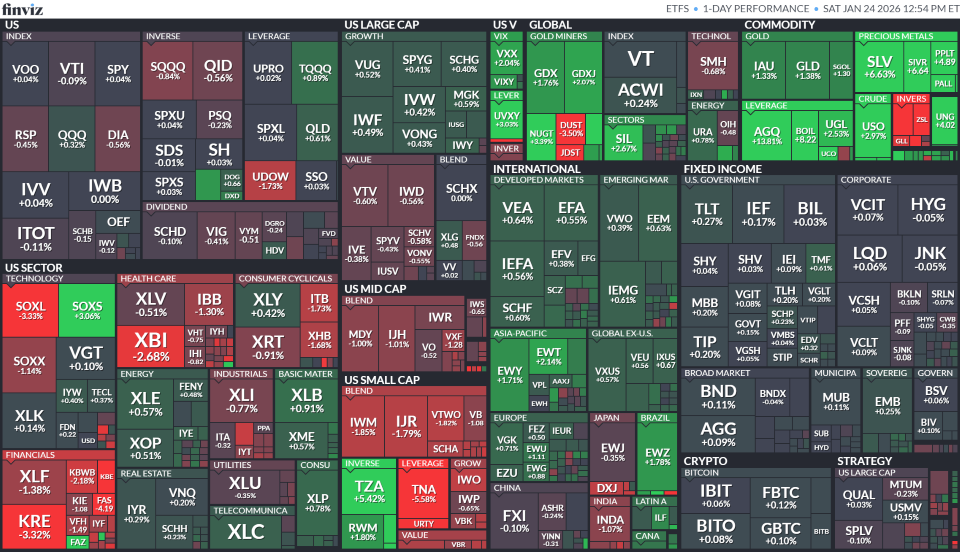
Visualize sector ETF performance in real-time with FinViz Elite: